Tap anywhere outside image to close
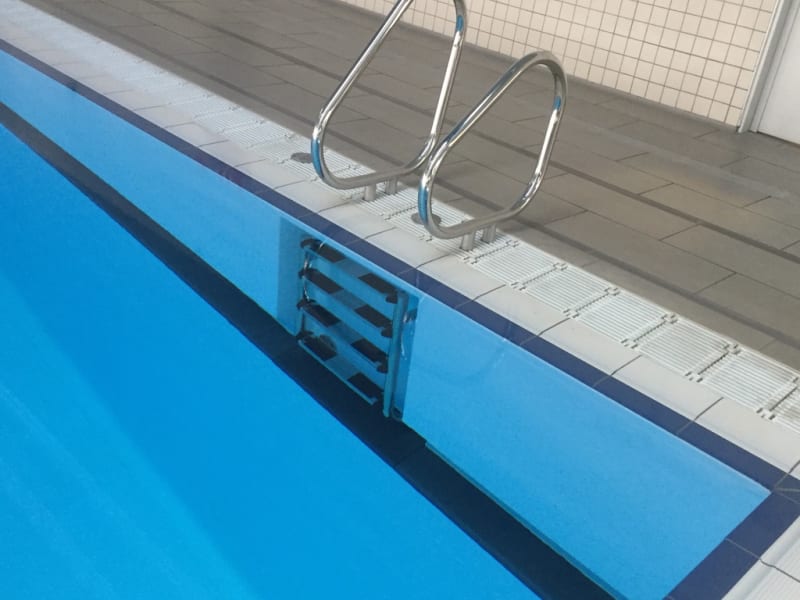
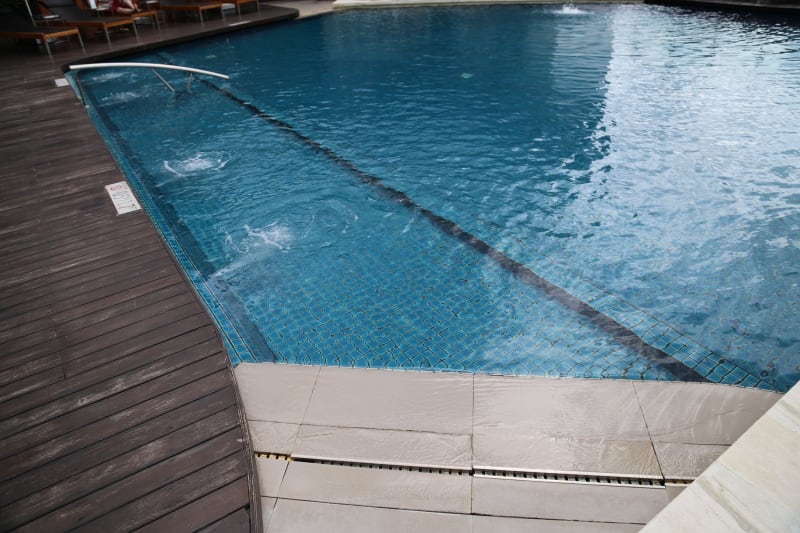
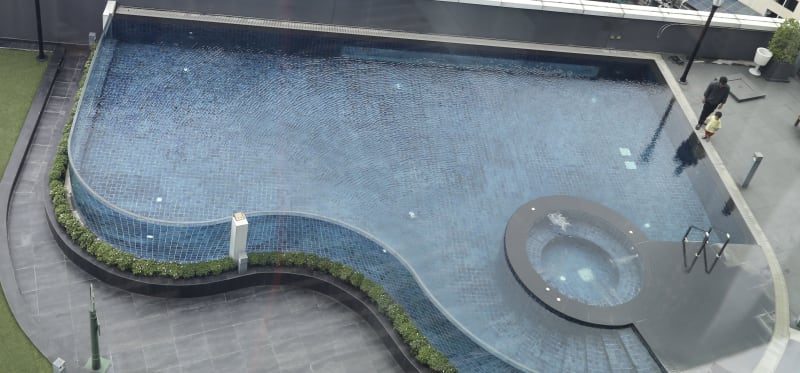
Plant room installations, competition pool detailing, and pool surround specification — shown for architects and consultants studying the standard.
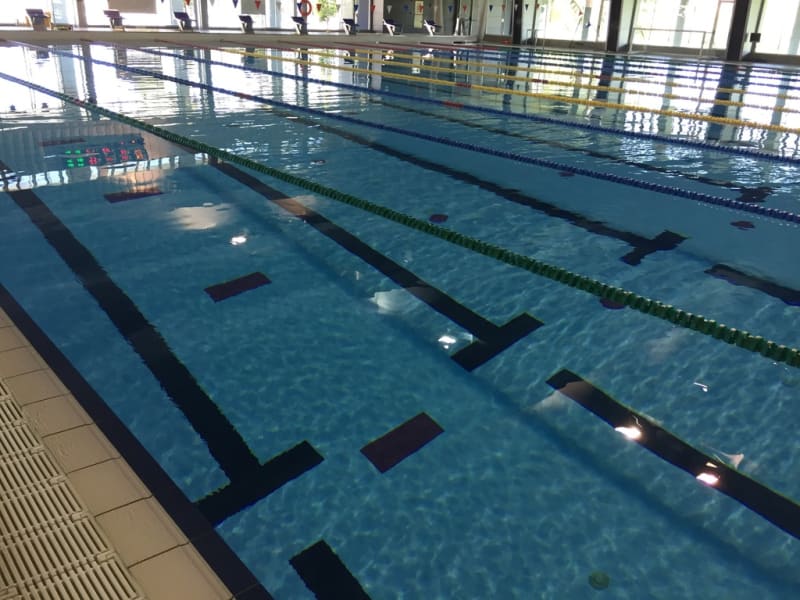
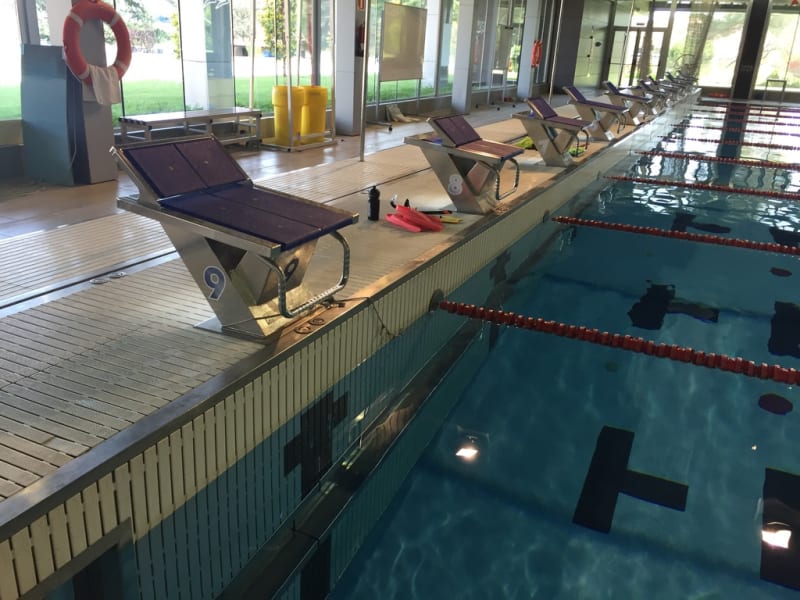
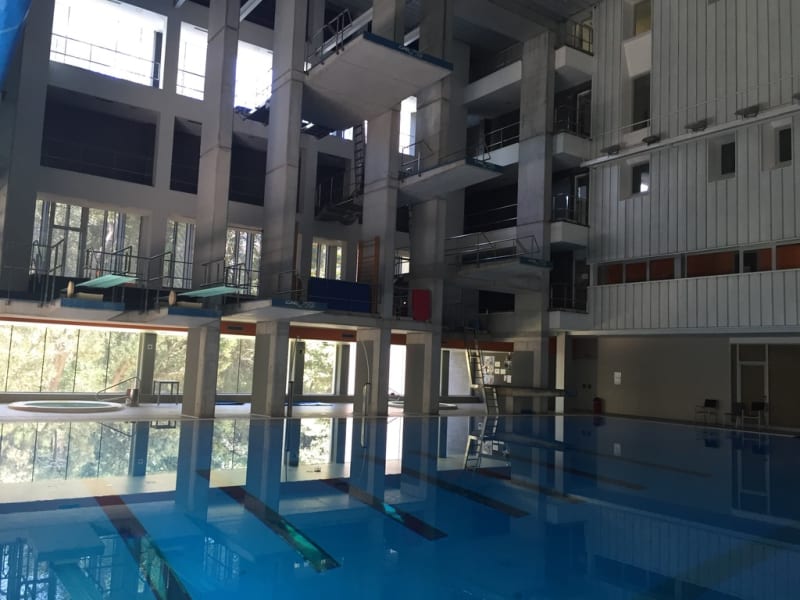
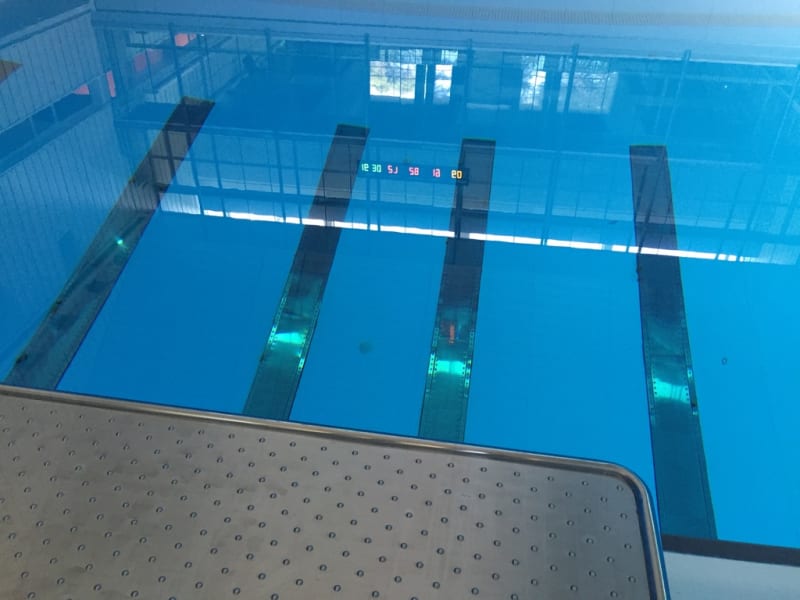
Lane discipline, touchpad placement, bulkhead tolerances, and deck clearances at competition standard — shown here for architects and consultants studying the specification, not as a record of our own projects.
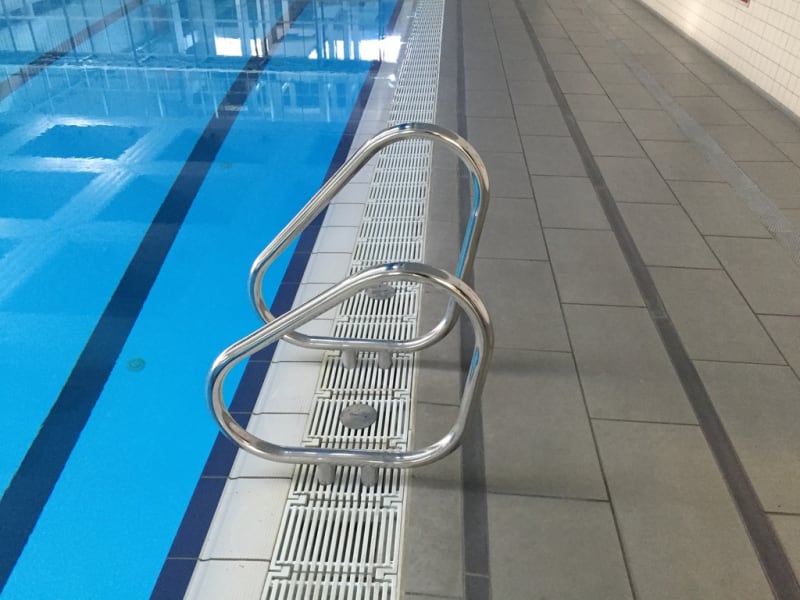
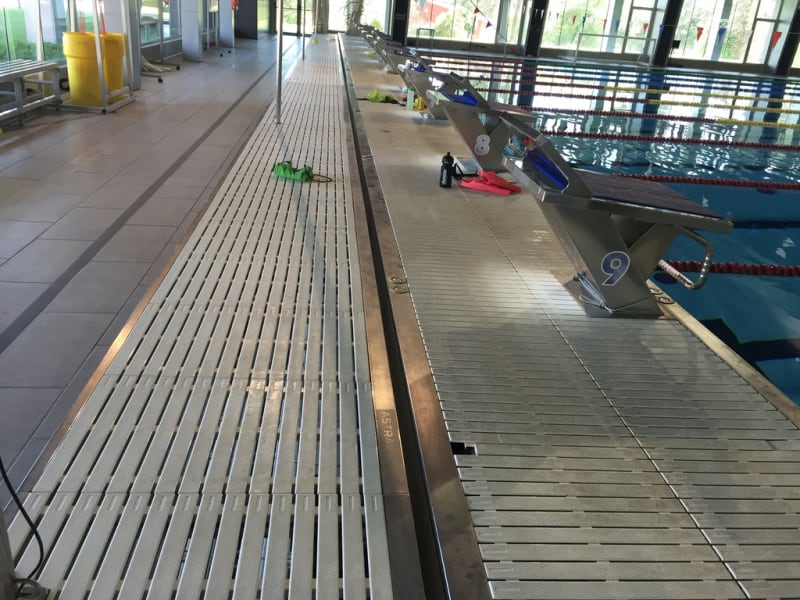
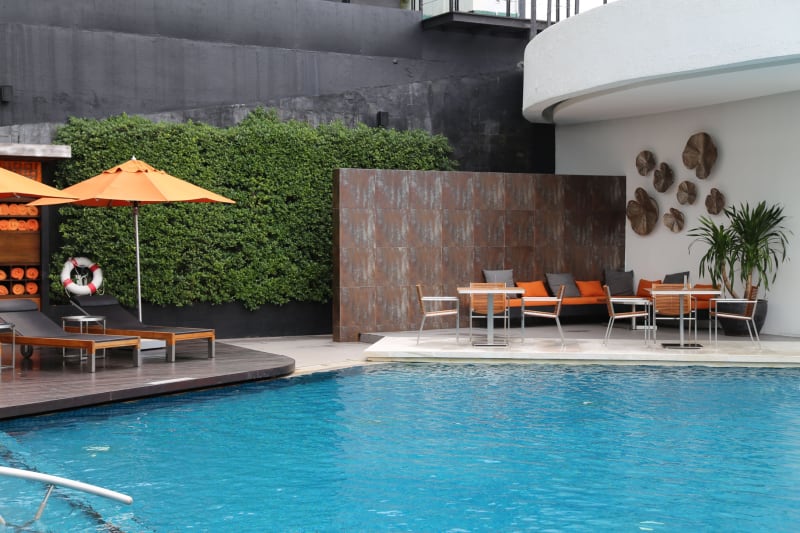
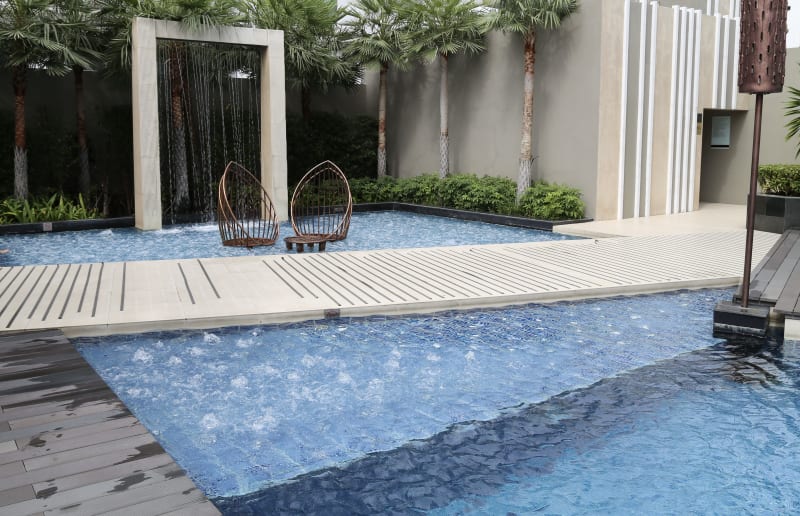
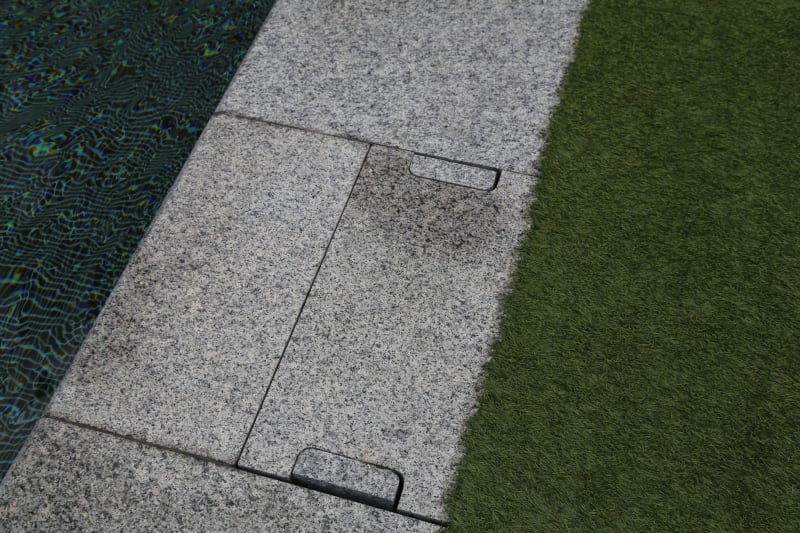
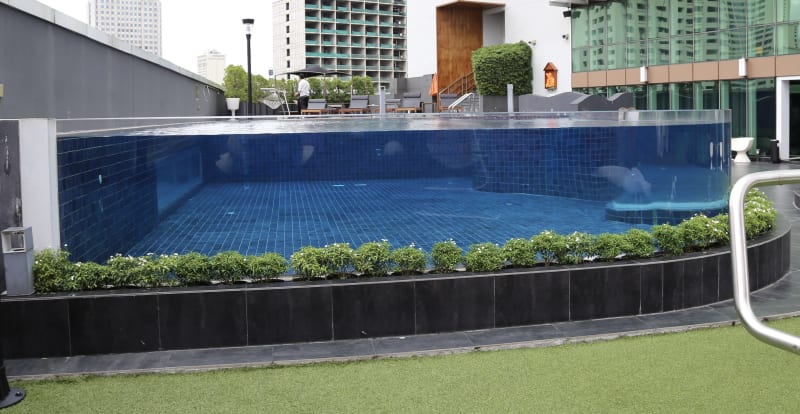
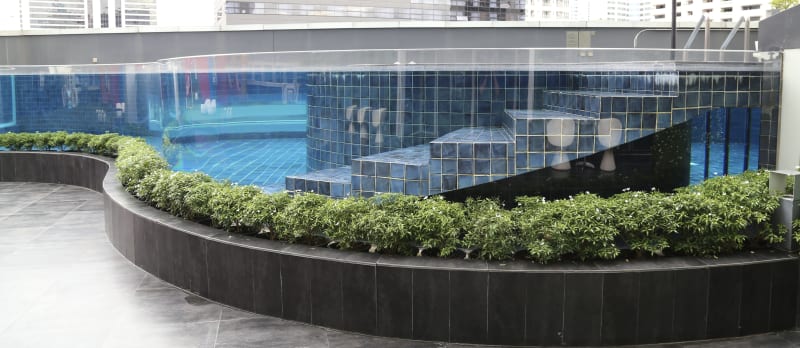
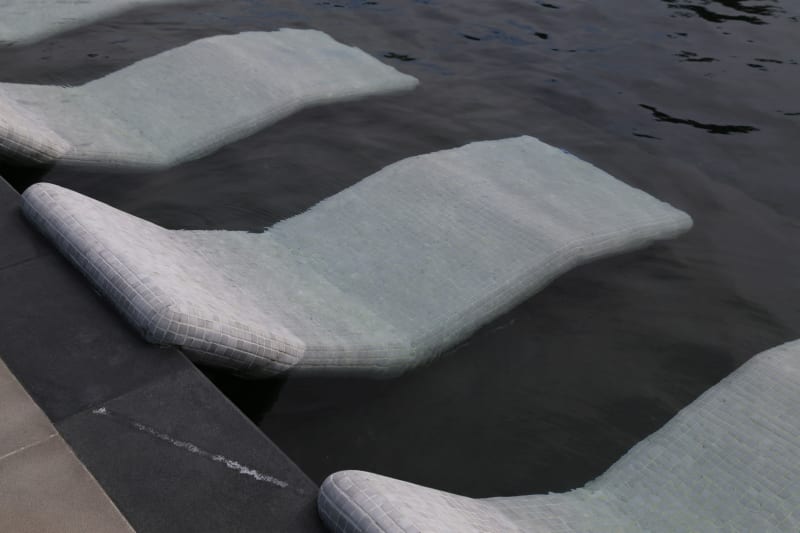
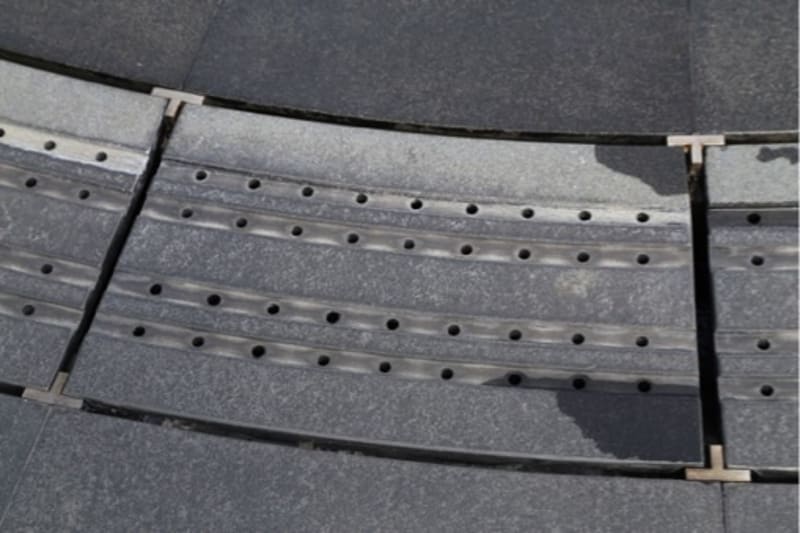
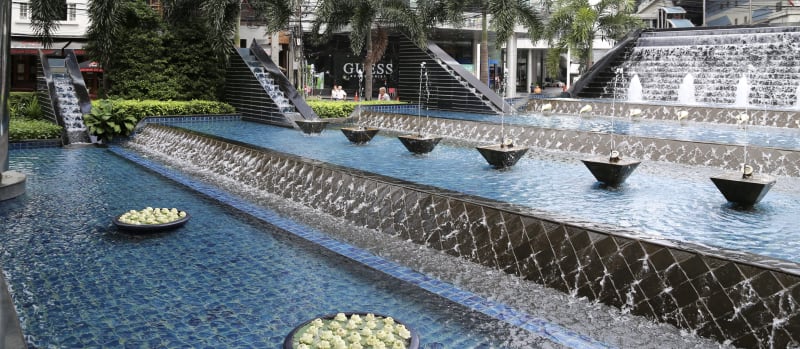
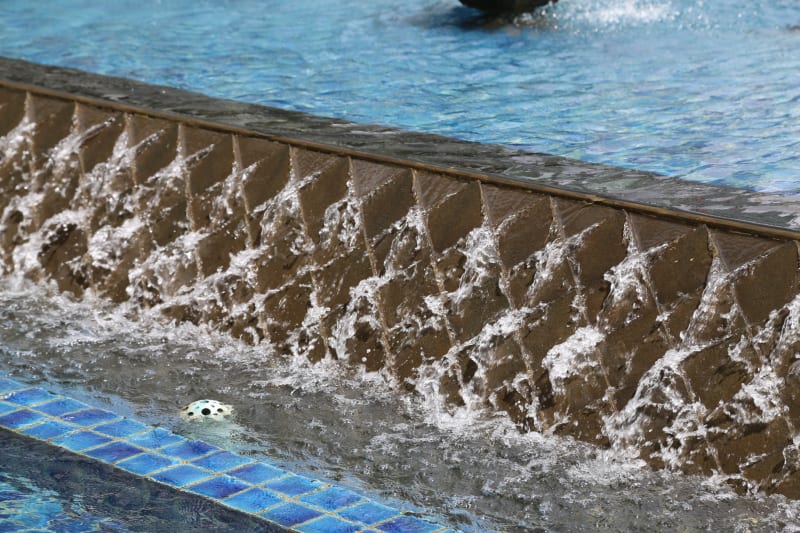
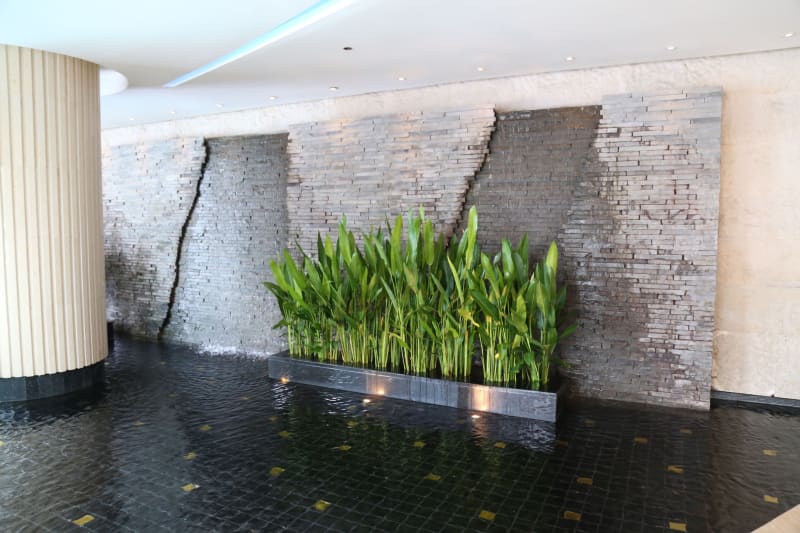
Coping, decking, drainage, and the landscaping choices that finish a pool's edge — shown here for reference and learning, not as a record of our own projects.
The details above are visible on site. This one isn't — but it determines water clarity as much as anything shown here. The chart below shows how particulate removal efficiency falls as filtration velocity increases, and how glass media outperforms silica sand at every velocity band.
Particulate removal efficiency vs. filtration velocity — glass media vs. silica sand. Hover over the chart for exact readings.
Sand-curve shape and the 25 m/h threshold reflect PWTAG's published filtration rate guidance (low-rate ≤10 m/h, medium-rate 10–25 m/h, high-rate 25–50 m/h; high-rate ≈10–25% as effective as medium-rate). Source: pwtag.org. Glass-media curve reflects directional industry consensus on finer particle capture, not a single controlled study.
Cartridge filters typically capture particles down to 10–20 microns — finer than sand (20–40 microns), coarser than glass (3–10 microns). Shown as a single reference value, not a velocity curve: cartridge systems use a much larger surface area at a fundamentally different, lower flux rate than sand or glass beds, and PWTAG does not publish an efficiency-vs-velocity relationship for them.